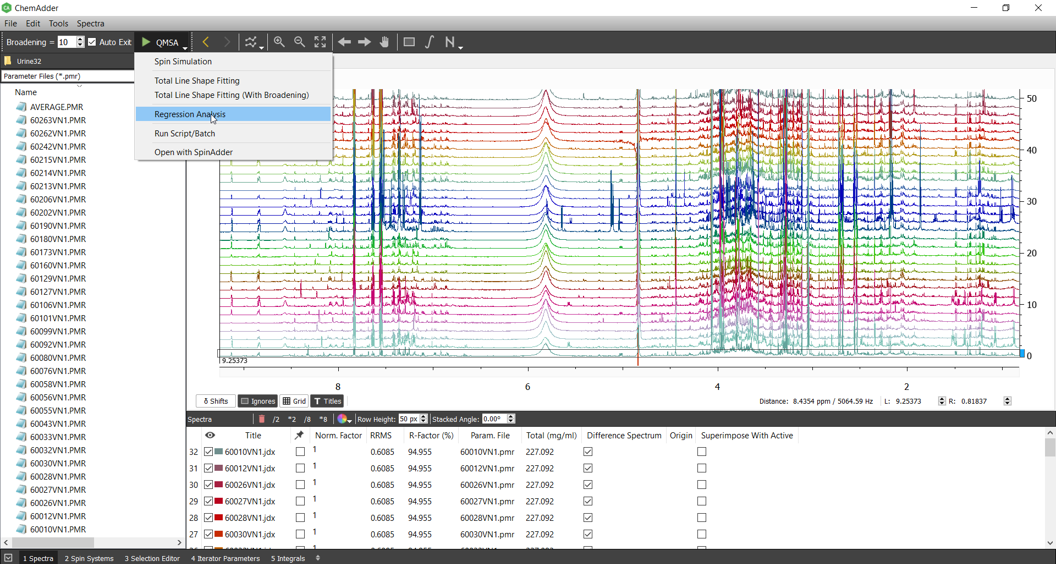
The simplest way to analyze an sample is an regression analysis:
I(ν) = ∑ x iIi(ν)
where the observed spectrum I(ν) is a sum of spectra components Ii(ν) and xi is the molar% of the component i. The group of linear equations can be solved with standard regression analysis or Principal Component Regression (PCR) to avoid problems arising from strong correlations (similarity of the component spectra).
Chemical shifts vary from sample to another typically by < 0.01 ppm (6 Hz at 600 MHz) and if the chemical shifts cannot be predicted from the sample (Holistic qQMSA, see ChemAdder_HOLISTICS), one can apply broadening to the spectrum.
If we set broadening (see ChemAdder_QMSA BASICS) to 6 Hz (an estimate for chemical shift variation in untargeted model) and use PCR with threshold of 0.01%, the analysis takes ~ 15 sec/spectrum (~ 4 sec using Multitasking) and yields rank of 187. This means that 187 independent descriptors explain 99.9% of the variance, while the number of chemical components is 208. Some of the descriptors are populations of pure components, the rest are sums of spectrally similar ones.
If chemical shifts are known accurately, the broadening and PCR are not needed - analysis takes ~ 10 sec/spectrum (~ 3 sec using Multitasking).
The chemical shifts, line-widths and response factors can be optimized with SpinAdder – results are to be reported in due time. Normally couplings can be kept fixed, as also the response factors except maybe for the major species.
